The Crosstabs function on the PAYS Web Tool allows you to examine responses to one
variable on the PAYS relative to responses on a second item. For example, you might
be interested in knowing whether there are differences in 30 day alcohol use between
youth who believe their parents would say it is “Very wrong” for them to use alcohol
vs. “A little bit wrong.” Alternatively, you might be interested in knowing what
percentage of students using alcohol in the past 30 days also reported using marijuana in the past
30 days. Using the Crosstabs function can provide answers to these types of questions.
Identify the two PAYS items that you are interested in
examining using the drop down lists (Question 1 and Question 2). For the crosstab
output table to provide the information you desire, it is important that the two
questions be entered in the appropriate order (i.e., reversing the order of the
two items will not provide the same response frequencies). The Question 1 field
serves as the primary variable of interest, while the Question 2 field serves as
the contextual variable. For example, if you are interested in examining 30 day
alcohol use (primary variable), in relation to parent’s attitudes about their children
using alcohol (contextual variable), you would choose item X10a (How many times
in the past 30 days have you had beer, wine, or hard liquor) for the Question 1
field, and item B23d (How wrong do your parents feel it is for you to drinking beer,
wine, or hard liquor regularly) for the Question 2 field (see example below).
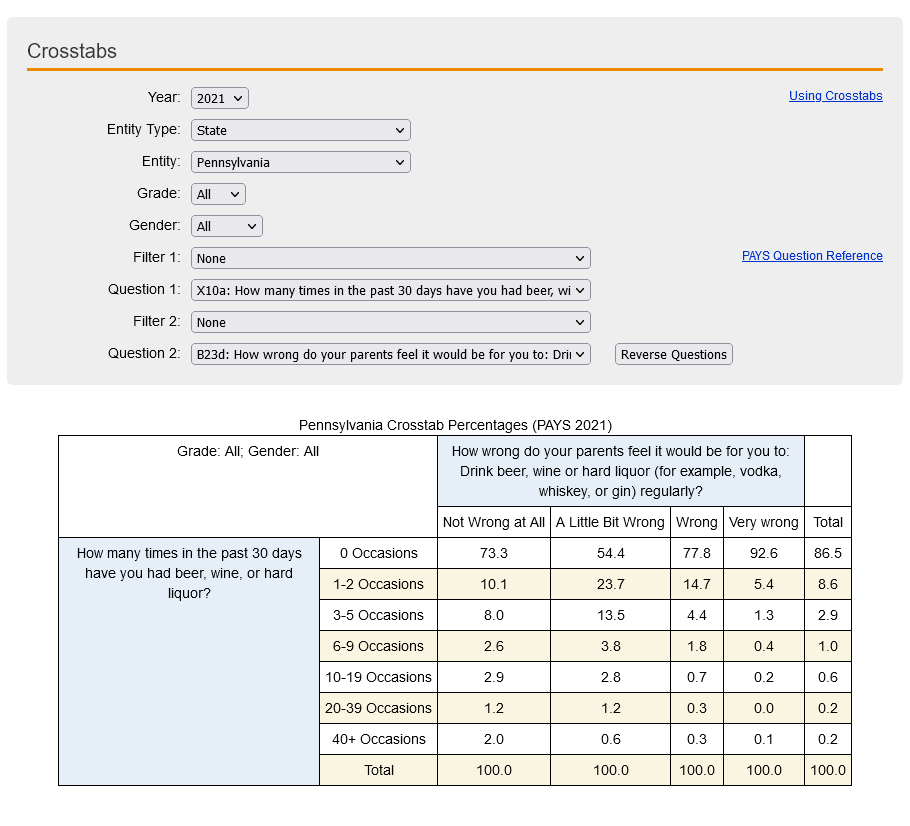
The crosstabs output table presents the percentage
of participants who indicated each response to the primary variable, based on their
response to the contextual variable. In the example above, you can examine 30 day
alcohol use responses based on perceived parental attitudes about youth alcohol
use. For youth who indicated that their parents would feel it was “Not Wrong at
All” for them to use alcohol only 73.3% reported not using alcohol, 10.1% indicated
using 1-2 occasions, 8.0% indicated using 3-5 occasions, etc. By contrast, for youth
who indicated that their parents would feel it was “Very wrong” for them to use
alcohol, 92.6% reported not using alcohol, 5.4% indicated using 1-2 occasions, 1.3%
indicated 3-5 times, etc. The percentages provided within each column will always
add up to 100% because the percentage in each cell reflects only the total number
of participants who indicated the specified response to the contextual variable.
In contrast, the row totals present the overall percentage of participants who indicated
each response to the primary variable (e.g., 86.5% of all participants [regardless
of response to perceived parental attitudes] indicated using alcohol on “0 Occasions”
in the past 30 days). This highlights the importance of entering the survey items
in the correct order with Question 1 as the primary variable of interest, and Question
2 as the contextual variable.